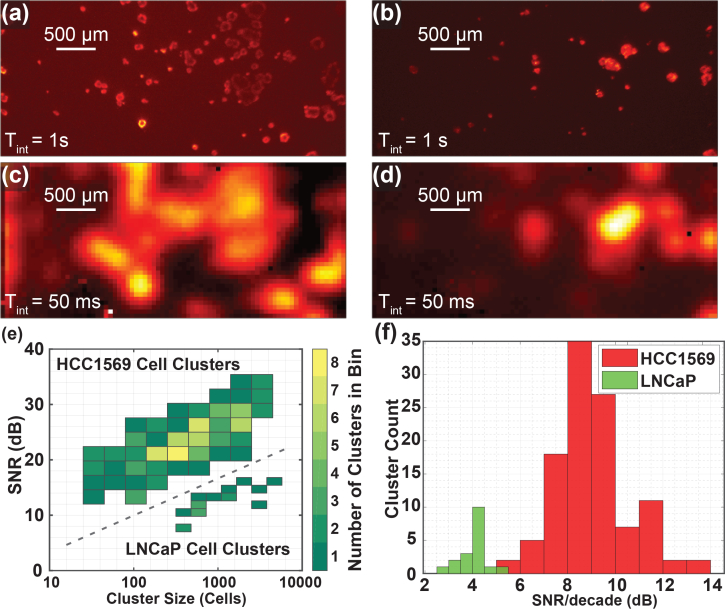
Fig. 2.
Images of two locations of slides containing HCC1569 breast cancer 3D cell cultures. (a,b) Long, 1 s, integration time fluorescence microscope images. (c,d) Corresponding 50 ms images taken with the custom contact image sensor. (e) Histogram of HCC1569 and LNCaP cell clusters for SNR and size. The colorbar indicated how many cell clusters fall into each bin. HCC1569 clusters appear in the upper-left and LNCaP clusters appear in the lower-right. Integration times of 50 ms and 70 ms were used for HCC1569 and LNCaP samples, respectively. (f) Histogram showing SNR per decade calculated for each HCC1569 and LNCaP cluster imaged.

