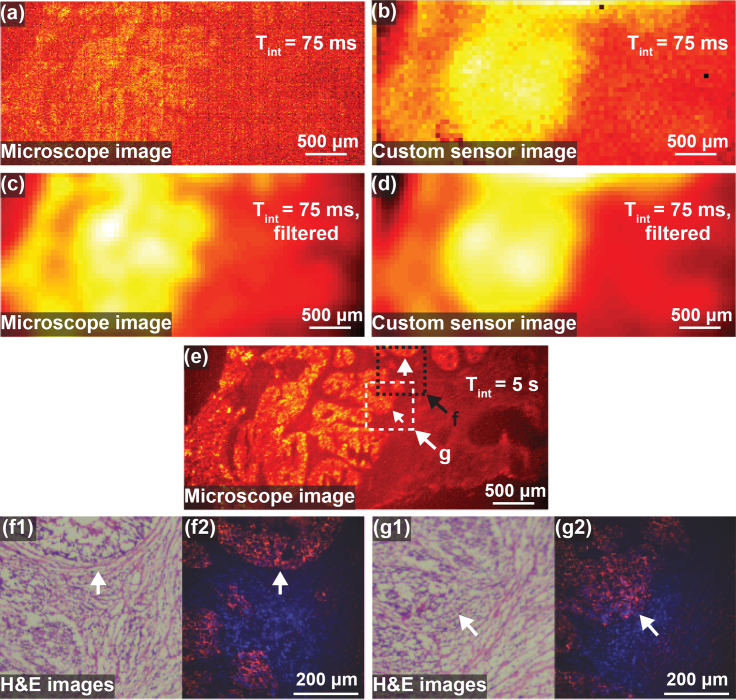
Fig. 6.
Images of human HER2+ breast cancer tissue slices. (a) Raw 75 ms fluorescence microscope image. (b) Raw 75 ms custom sensor image. (c) Fluorescence microscope image filtered with 2D Gaussian filter with standard deviation 110 μm. (d) Custom image filtered with 2D Gaussian filter with standard deviation 110 μm. (e) 5 s integration time fluorescence microscope image for reference. (f1,g1) Two regions, labeled f and g in (e), were examined using hematoxylin and eosin (H&E) as shown in order to confirm tumor margin. (f2,g2) Higher magnification fluorescence images (red) are shown overlaid on DAPI stain images (blue) of the same regions.

