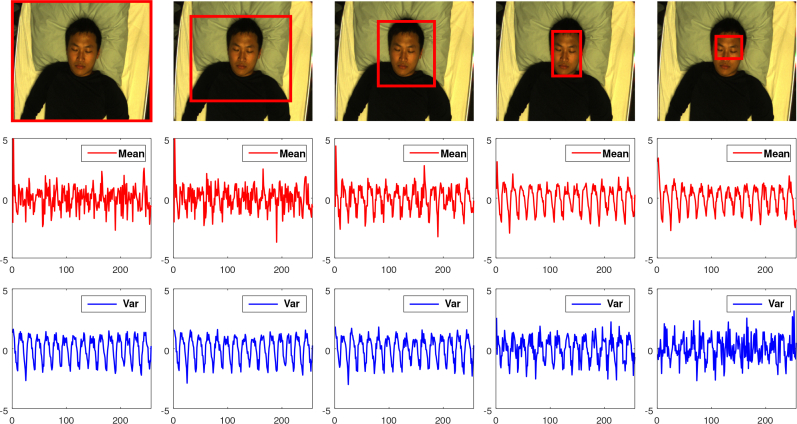
Fig. 4.
Comparison of using the mean and variance (var) to combine pixel values in an image. The mean-signal (red) and var-signal (blue) are generated by mean(R/G) and var(R/G) respectively, where R and G are color planes from different RoIs (e.g., red bounding-box). Note that for the visualization purpose, both the mean-signal and var-signal have the low frequency component (< 40 bpm) removed, mean subtracted and standard deviation normalized. Given different RoIs, the mean-signal and var-signal show complementary strength, i.e., when non-skin pixels dominate the RoI, var-signal is better; when skin-pixels dominate the RoI, mean-signal is better.

