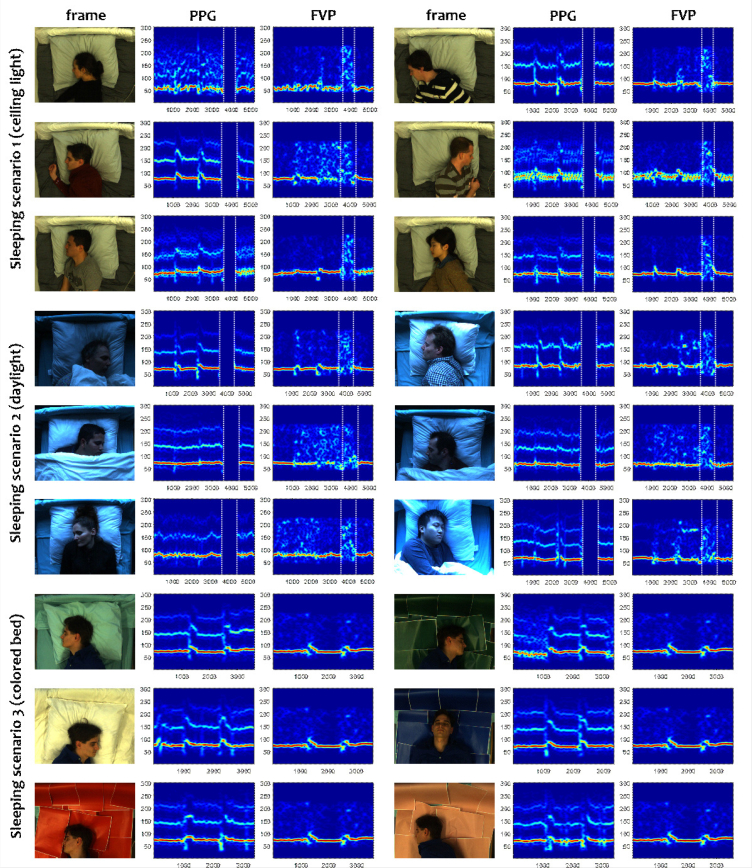
Fig. 6.
The spectrograms obtained by the PPG reference and FVP in the sleeping experiment. This experiment includes three different sleeping scenarios. The white dash lines in the spectrograms of the sleeping scenario 1–2 indicate the time-slot of bed exit. The X- and Y- axes of the spectrogram denote the time (video frame index) and frequency (bpm).

