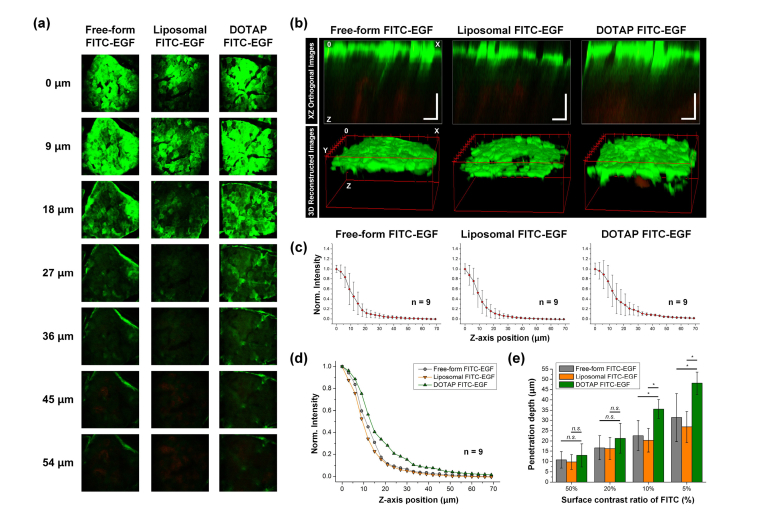
Fig. 3.
(a) Representative sequential images of human skin samples at 24 hours after the application of free-form FITC-EGF, encapsulated FITC-EGF with general liposome or DOTAP complex. (b) Reconstructed images in XZ orthogonal view and 3D view. Scale bars: 50 μm. (c-d) Averaged normalized FITC-EGF signal intensity along the z-axis from surface to dermal layer of the human skin samples. (e) Penetration depth of FITC-EGF with different thresholds of 50, 20, 10, and 5% of fluorescence intensity measured at the skin surface.

