Fig. 2.
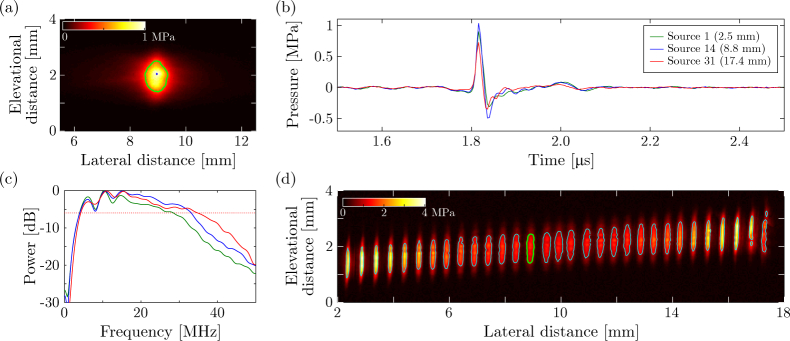
Characterisation of the acoustic sources. (a) Peak acoustic pressure generated by a single source measured across a plane placed 2.7 mm away from the ultrasound-generating membrane. The green contour indicates the full-width-at-half-maximum (FWHM) of the acoustic pressure; the blue dot indicates the location where the corresponding pressure data (shown in blue) of panels (b-c) were recorded. (b) Temporal pressure profiles emitted by three optical ultrasound sources positioned at lateral co-ordinates of 2.5 mm (green), 8.8 mm (blue; corresponding to the pressure field displayed in panel (a)) and 17.4 mm (red). These profiles were recorded at a distance of 2.7 mm and measured directly in front of each source. (c) Power spectra (normalised to 0 dB) of the three temporal pressure profiles displayed in panel (b). The dotted red line corresponds to the −6 dB level used to determine the acoustic bandwidth. (d) Compound image of the peak pressure at the surface of the ultrasound-generating membrane. The contours correspond to the FWHM obtained for each of the 31 sequentially addressed sources, and are representative of the size of the acoustical sources. The green contour corresponds to the source measured in panel (a).

