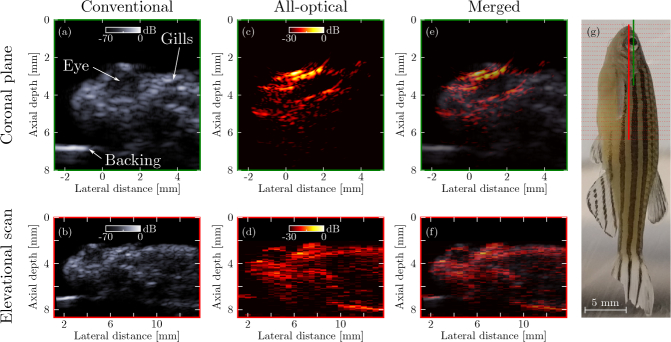
Fig. 4.
Ultrasound images of an ex vivo zebrafish. Images were obtained with both a conventional high-frequency piezoelectric array probe (a–b) and the presented all-optical set-up (c–d). Conventional and all-optical images were merged (e–f) to facilitate comparison. Panels (a) and (c) were obtained from single images along the coronal plane through the eye; panel (d) was extracted from a stack of 26 images acquired in transverse planes spaced 0.5 mm apart. Panel (g) shows the location of the single coronal plane (green line), as well as the individual transverse planes (red dotted lines) and the extracted image plane (solid red line).

