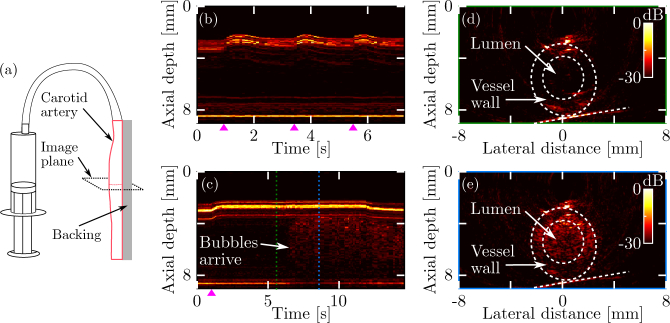
Fig. 5.
Dynamic 2D all-optical ultrasound imaging of an ex vivo swine carotid artery. (a) Schematic of the phantom geometry. A section of carotid artery was fixed to a rigid backing and connected to a syringe. Both syringe and artery were filled with water. (b) M-mode image of the line through the centre of the artery. With the distal end of the artery clamped shut, images were continuously recorded (frame rate: 15 Hz) while the syringe was manually compressed and released thrice. (c) M-mode image obtained during flushing of the artery with water loaded with glass bubbles. (d–e) B-mode images obtained before and after the arrival of the bubble bolus, respectively. These images were acquired at the time points indicated by the green and blue dashed lines in panel (c). The real-time, video-rate reconstructed B-mode images corresponding to the compression and flushing experiments can be viewed in Visualization 1 (1.4MB, mp4) and Visualization 2 (2.1MB, mp4) , respectively. Time points corresponding to pressure onset are indicated (
 ).
).

