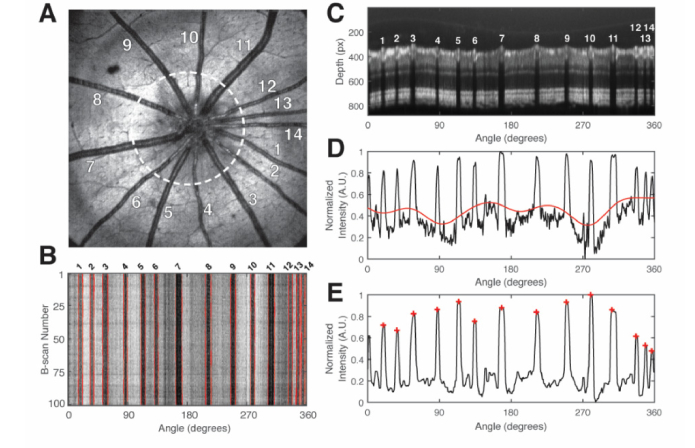
Fig. 2.
Vessel detection procedure. (A) En face raster scan of an adult rat retina. The white dashed circle indicates the approximate path of the circumpapillary scan on the retina. Numbers 1-14 identify the fourteen vessels; (B) En face of the circumpapillary scan OCT volume. Numbers 1-14 correspond to the vessels in A; (C) Average vis-OCT B-scan of the flattened circular scan volume. Numbers 1-14 correspond the numbers in A and B. Depth pixel size: 0.55 μm; (D) Black line indicates the two-dimensional shadowgram, calculated from C. Red line indicates the baseline, after low pass filtering; (E) Black line indicates the shadowgram after baseline subtraction and median filtering. Each red-cross indicates a peak corresponding to a vessel.

