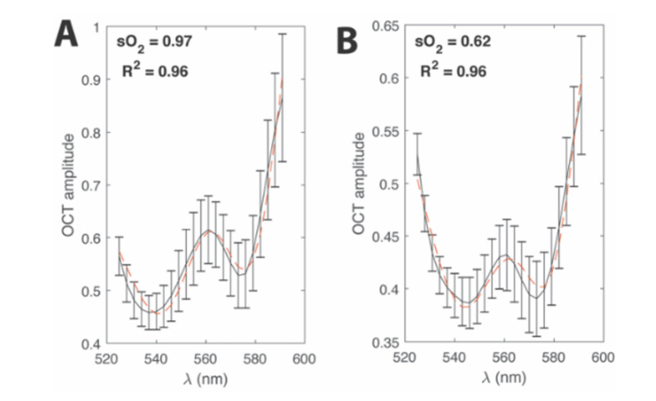
Fig. 6.
Spectral fitting. (A) Example of the least-squares spectral fit for an artery (vessel number 7 from Fig. 2). (B) Example of a least-squares spectral fit for a vein (vessel number 8 from Fig. 2). Black lines denote the measured average OCT amplitude after the graph-search algorithm. Error bars show the standard error of the mean of the OCT amplitude.

