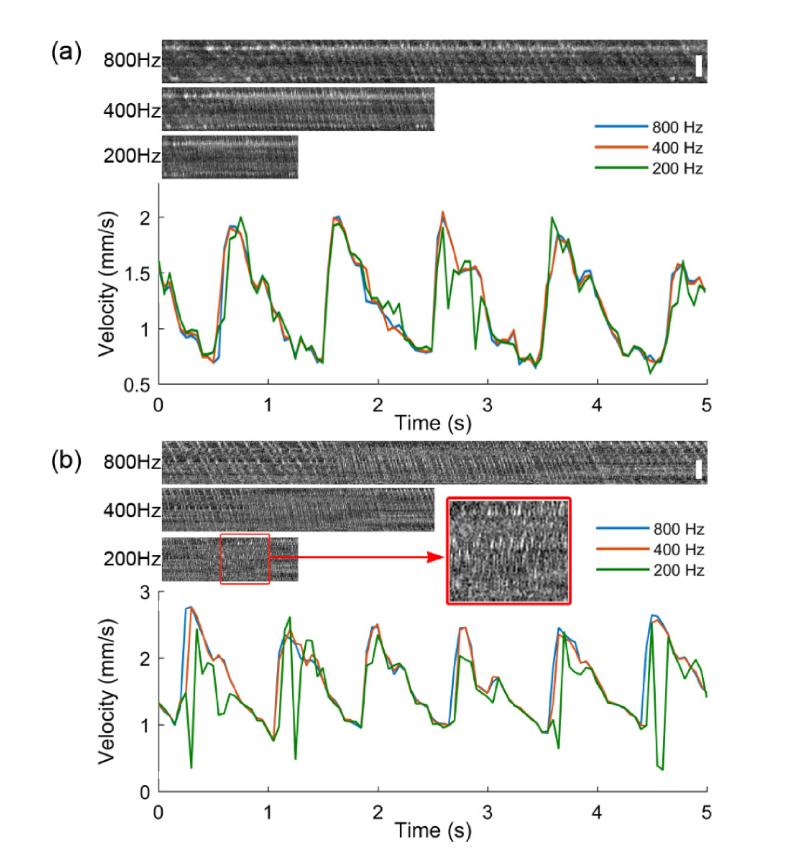
Fig. 6.
Erythrocyte velocity measured by retinal imaging at frame rates of 800 fps, 400 fps, and 200 fps. (a) Erythrocyte flow in a capillary with the maximum velocity < 2mm/s. (b) Erythrocyte flow in another capillary with the maximum velocity between 2 and 3mm/s. The retinal images were acquired at the frame rate of 800 fps with the imaging light focused on the capillary bed. Retinal images of 400 fps and 200 fps were generated by dropping off the intermediate frames from the images of 800 fps. The spatiotemporal plots were extracted from corresponding videos. The time span of the spatiotemporal plots is 1 cardiac cycle. The spatial scale bar is 25 µm.

