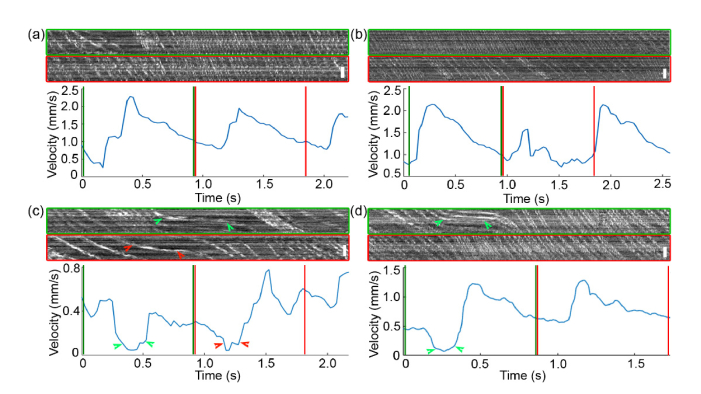
Fig. 9.
High speed imaging revealed fine movement of the erythrocytes. (a) The erythrocytes movement was slowed down by a leukocyte appeared at the beginning of the first cycle (the green box). (b) The erythrocytes movement was distorted by leukocytes (hypo-reflective bands in the red box). (c) Temporary blood cell traffic jam at the vicinity of a confluence point (Visualization 4 (31.1MB, avi) , acquired at 400 fps with a field of view of 1.2° × 0.6°, displayed at 30 fps), causing almost stoppage of the blood flow and nearly flat spatiotemporal traces (green and red arrowheads). (d) Temporal arresting of the erythrocytes (Visualization 5 (23.7MB, avi) , acquired at 800 fps, displayed at 30 fps). All spatiotemporal plots were extracted from retinal images acquired with the imaging light focused on the capillary bed. The velocity waveforms in the regions indicated by the color lines were measured from the boxes of corresponding color. Scale bar is 25 µm.

