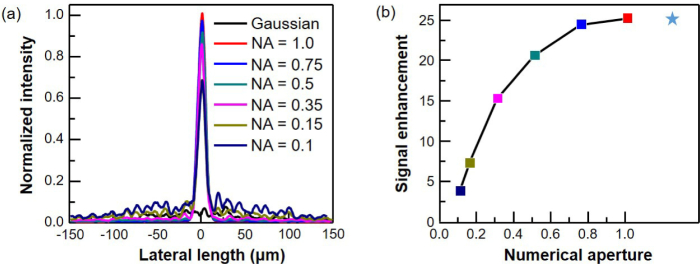
Fig. 9.
(a) Electric field intensity of Gaussian beam and of shaped-wavefront beam with NA of 0.1, 0.15, 0.35, 0.5, 0.75, and 1 at depth of 300 µm. (b) Signal enhancement of WS-OCT modeled with corresponding NA. Star mark represents signal enhancement for ideal case, for which full spatial information is used.

