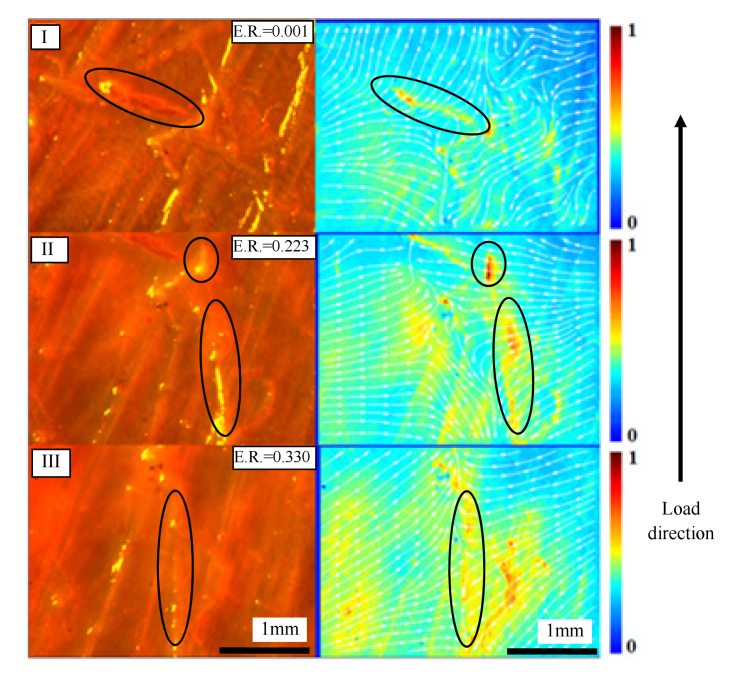
Fig. 4.
Left column: white light images of the tissue samples. Right column: intensity maps of the RL emission and their corresponding DVF. The color scale was normalized to the maximum intensity value found during the test. Each row corresponds to a different stress condition (I: ER = 0.001, 0.2MPa; II: ER = 0.223, 4.7MPa; III: ER = 0.330, 7.3MPa). Black ovals show some of the superficial fibers matching the high intensity zones in the RL intensity mapping. The black arrow in the right indicates the direction of the applied load.

