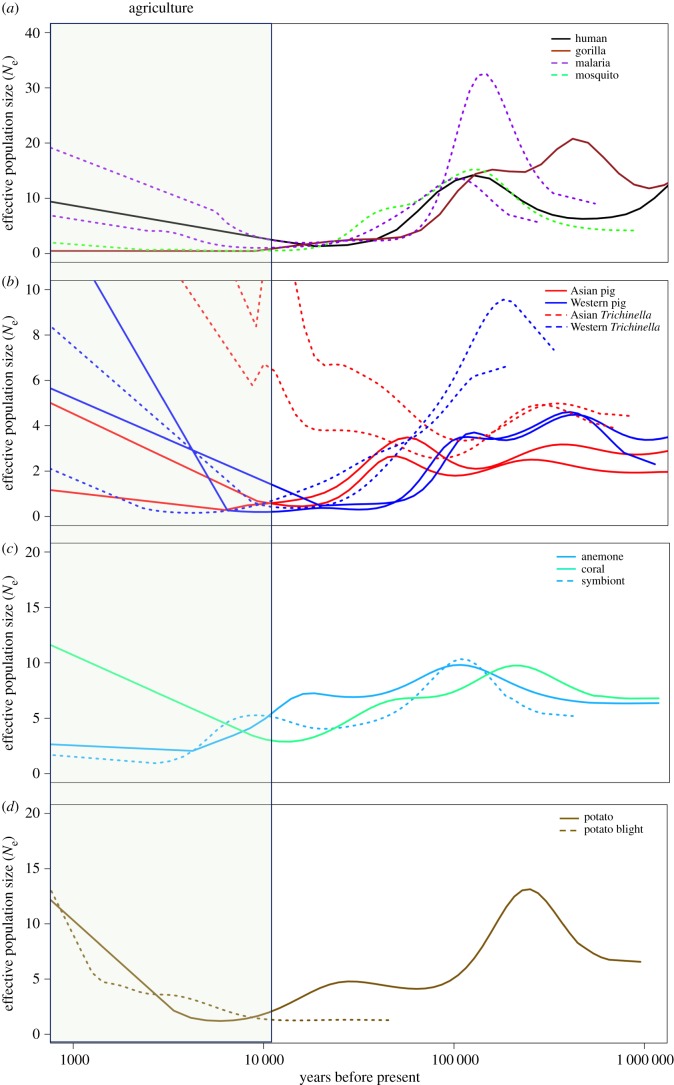
Figure 1.
PSMC plots comparing the demographic histories of hosts and their putative parasites/symbionts. The vertical axis is scaled to 104. The time period associated with human agriculture (most recent 12 000 years) is shaded. Solid lines represent hosts, whereas dotted lines represent their parasites or symbionts. (a) A. gambiae mosquito and two Pl. falciparum parasite populations appear to have grown and contracted in sync with human, but not gorilla, populations over the last 500 000 years. Demography estimated from each of two pseudo-diploid malaria genomes illustrated (see electronic supplementary material, methods). (b) Both Chinese T. spiralis isolates (red dashed lines) mirror the demographic history of sympatric members of their host species (solid red lines), while North American T. spiralis (blue dashed lines) was more similar to wild boar and pig populations from Europe (solid blue lines). (c) The algal symbiont S. minutum has tracked the demography of its known host, the anemone E. pallida, rather than the coral Acropora digitifera, at least since the LGM (approx. 20 ka). (d) Phytophthora infestans, the agent of potato blight, only shows concerted growth or decline with potatoes since domestication.

