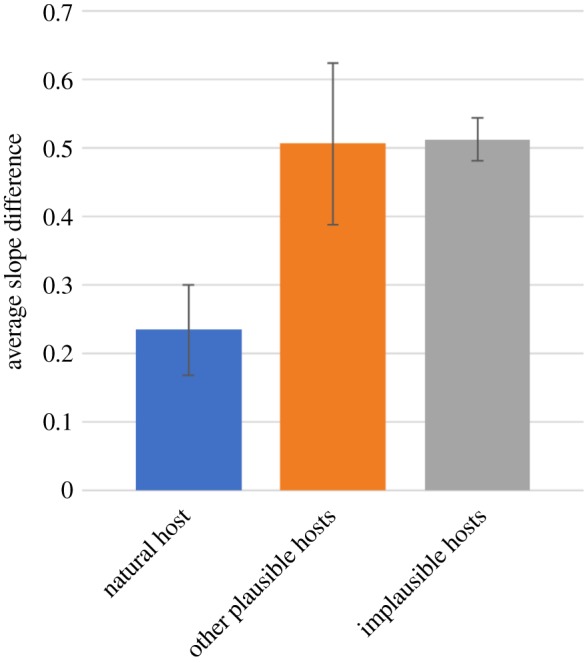
Figure 2.

Comparison of minimum average slope difference for the natural host (e.g. Pl. falciparum × human; n = 13) versus plausible (e.g. Pl. falciparum × gorilla; n = 12) and implausible (e.g. S. minutum × human; n = 56) alternative host–symbiont combinations. Error bars represent the 95% confidence interval of all comparisons. (Online version in colour.)
