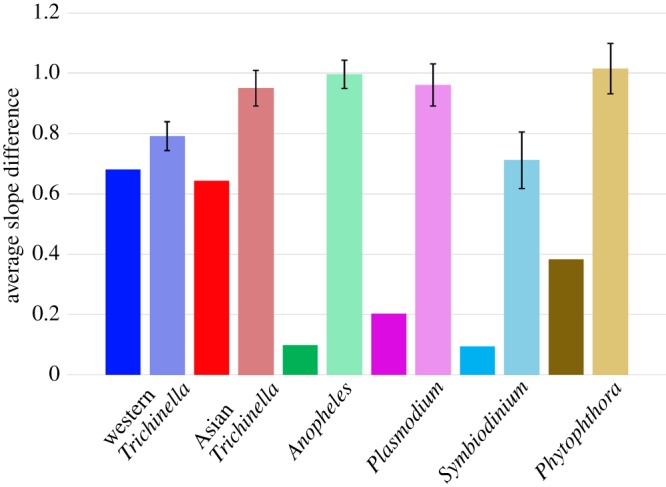
Figure 3.

Comparisons of average slope difference between unmodified curves (solid colour) and curves that have been randomized with respect to time (faded). Symbiont plots were aligned to their purported host plots (Western T. spiralis versus Western S. scrofa; Asian T. spiralis versus Asian S. scrofa; Pl. falciparum versus human; A. gambiae versus human; S. minutum versus Exaiptasia pallida; Ph. infestans versus potato) and the average difference in slope direction was calculated. The 99.9% confidence interval is shown in association with the randomized curves, based on the variance among randomization replicates (n = 5). Randomizing slopes with respect to time significantly worsened the match for every ecologically relevant pairing of species. (Online version in colour.)
