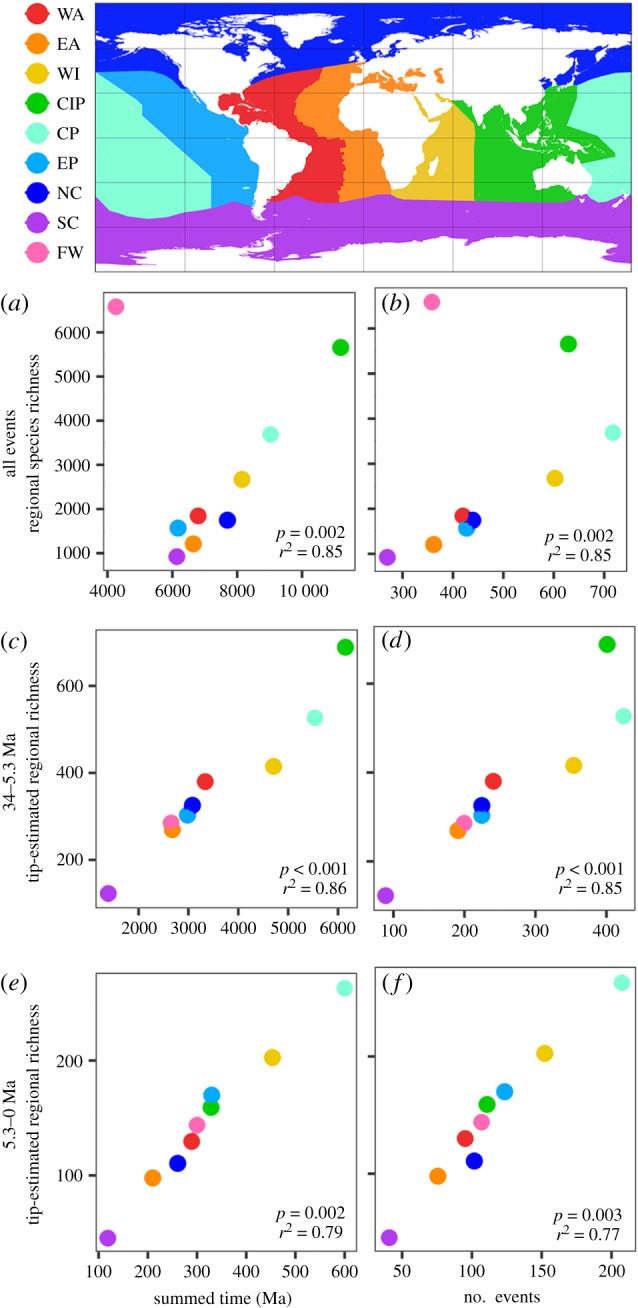
Figure 1.

The time-for-speciation effect and the number of colonization events explain differences in species richness among global-scale marine regions. (a) When all events are included, the CIP leads in summed time-for-speciation, with freshwater (FW) an outlier removed prior to analysis. (b) The number of colonizations is also strongly related to regional richness, but the CP has more colonizations than the CIP. (c,d) From 34–5.3 Ma, summed time also best explains high richness in the CIP. The CIP leads in number of colonizations only if fossil constraints are used (see electronic supplementary material, appendix S2). (e,f) From 5.3 Ma to the present, the WI and CP have the greatest summed time, most colonizations, and highest richness descended from these colonizations. All values are means of 100 stochastic reconstructions [36] (confidence intervals too narrow to be visible). The ‘tip-estimated regional richness’ (c–f) is the extant richness descended from lineages that colonized each region during the focal period, estimated from the phylogeny. Richness was log10-transformed prior to performing regressions. WA, Western Atlantic; EA, Eastern Atlantic; WI, Western Indian; CIP, Central Indo-Pacific; CP, Central Pacific; EP, Eastern Pacific; NC, northern cold; SC, southern cold; FW, freshwater.
