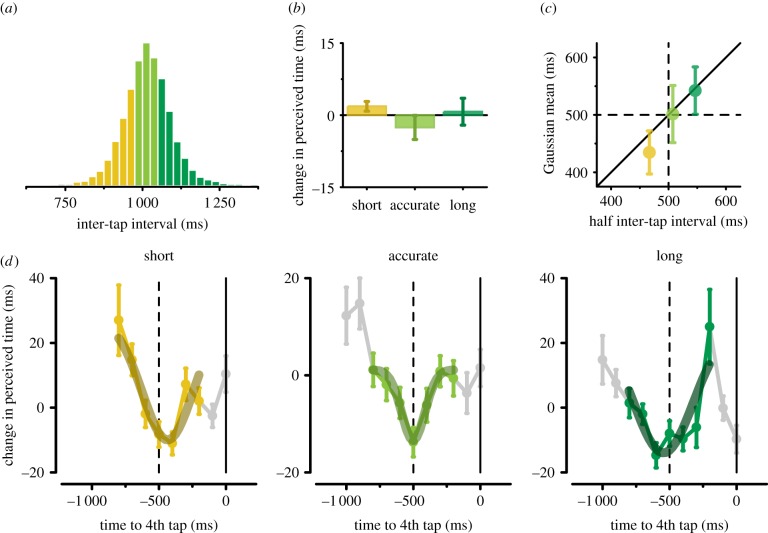
Figure 4.
(a) Distribution of the (last) inter-tap interval (data pooled across subjects). Trials are split into three categories: (i) short inter-taps (0.25 quantile of the distribution, yellow), (ii) accurate inter-taps (between the 0.35 and the 0.65 quantile, light green), and (iii) long inter-taps (≥0.75 quantile, dark green). (b) Average perceived duration (expressed as deviation from the mean PSE) for the short, accurate, and long trial categories (data collapsed across stimulus latencies). Error bars represent s.e.m. (c) The mean of the best-fitting Gaussian function is plotted against half of the inter-tap interval (median values) for the short (yellow), accurate (light green), and long (dark green) categories of trials. Error bars represent 90% confidence intervals calculated by bootstrap. The diagonal indicates that maximal perceived time expansion occurs halfway between the two consecutive finger taps. (d) Perceived visual duration aligned with the 4th tap and best-fitting Gaussian functions for the short, accurate, and long trials. Coloured symbols indicate the data used to fit the Gaussian functions (i.e. from −800 to −200 ms); data marked in grey were not used for the Gaussian modelling. Error bars represent s.e. estimated by bootstrap.

