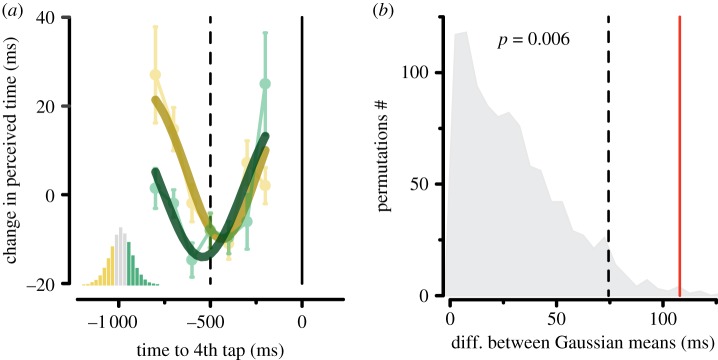
Figure 5.
(a) Best-fitting Gaussian functions for the short (yellow) and long (dark green) inter-tap categories superimposed to the time courses in perceived duration aligned to the 4th tap (same data shown in figure 4d). (b) Distribution of the difference between the means of the best-fitting Gaussian functions (indexing the latencies of maximal time expansion) obtained by randomly permuting (1 000 iterations) the trials belonging to the short and to the long categories. Dashed line: 0.95 quantile of the distribution. Red line: difference between the means of the Gaussian functions fitted to the short and long inter-tap trials.

