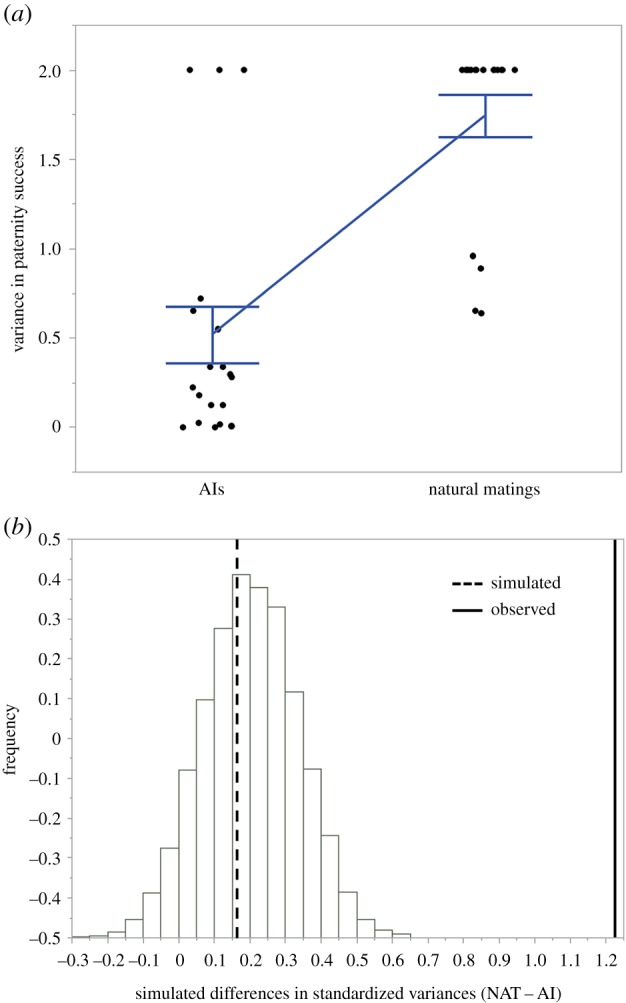
Figure 2.

(a) Observed standardized variance between AI and NAT treatments. (b) Simulated versus observed difference in standardized variance between AI and NAT. Vertical lines represent means (dotted line, simulated difference; solid line, observed difference). Positive values indicate that opportunities for postcopulatory sexual selection were greater in the NAT than in the AI treatment. (Online version in colour.)
