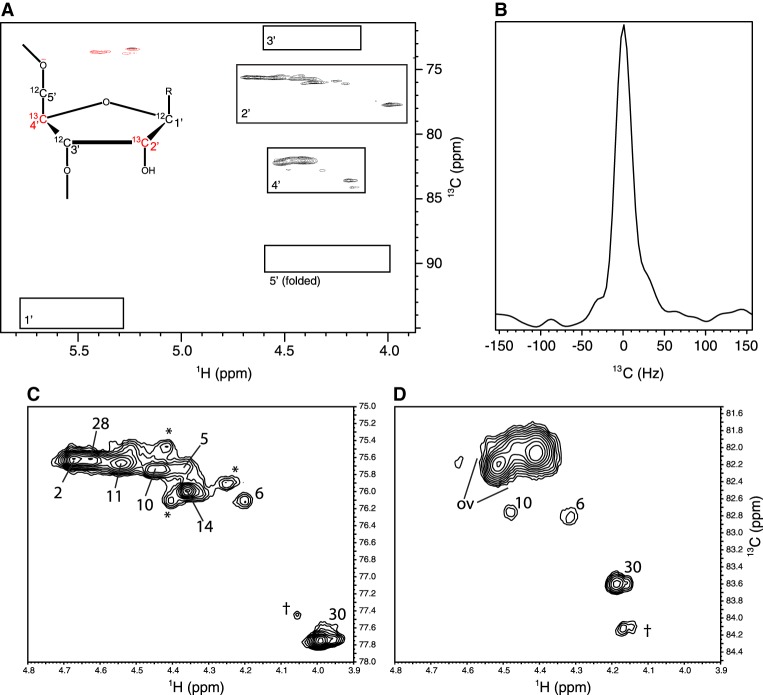
FIGURE 3.
(A) Two-dimensional non-constant-time HSQC spectrum for the ribose resonances of the 2′–4′-13C2-Cyt labeled leadzyme. Boxes indicate the regions in which the five types of ribose 1H-13C cross peaks arising from cytosine residues in this molecule would be expected (Legault et al. 1998). Predicted C5′ chemical shifts are folded from the ∼65 to 66 ppm region due to the restricted sweep width of the spectrum. (Inset) Schematic of the alternate-site labeling pattern with 13C-labeled sites in red. (B) Section along the 13C axis for a representative H2′–C2′ peak demonstrating the lack of multiplet structures that would arise from any one-bond 13C–13C interactions present. (C,D) Expansions of the 2′ and 4′ regions from A with the analyzed peaks labeled. “ov” indicates overlapped helical 4′ resonances not analyzed in this work, daggers indicate signals arising from 3′-end heterogeneity, and asterisks indicate inconsistently observed peaks that are attributed to a minor population of misfolded RNA (see text).

