FIGURE 5.

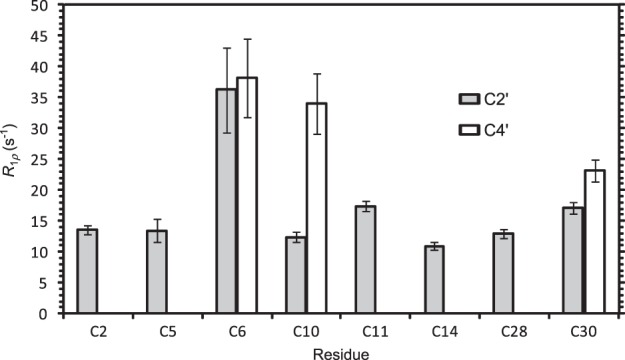
Transverse relaxation rates for the 2′,4′-13C2-cytidine-leadzyme. Values correspond to R1ρ data at γB1/2π = 3.0 KHz. Error bars are as reported by the fit software for a single-exponential decay.

Transverse relaxation rates for the 2′,4′-13C2-cytidine-leadzyme. Values correspond to R1ρ data at γB1/2π = 3.0 KHz. Error bars are as reported by the fit software for a single-exponential decay.