FIGURE 1.
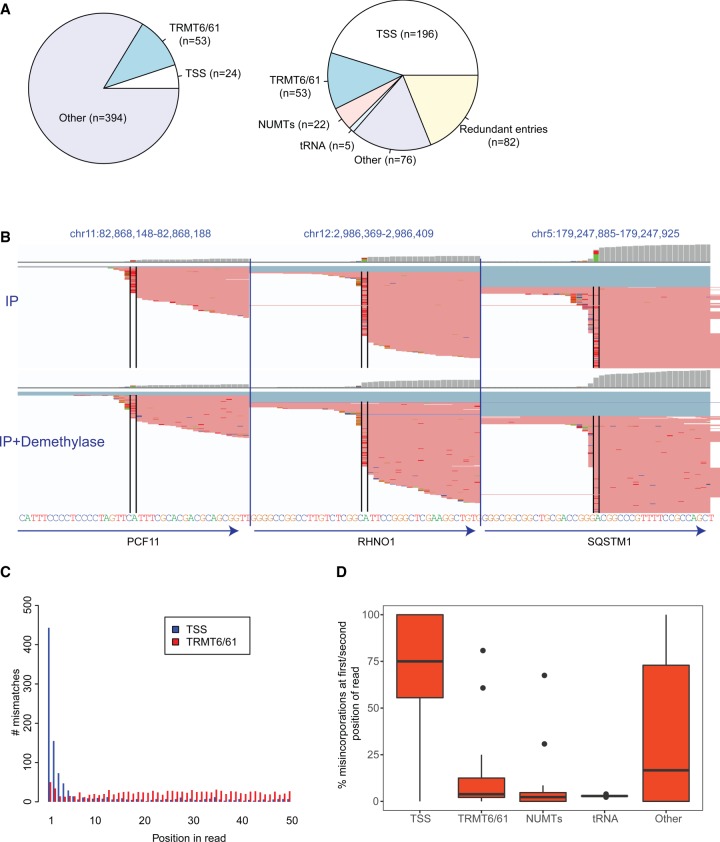
Reannotation and characterization of putative m1A sites identified by Li et al. (2017) (A) Pie charts depicting the original classification of the putative m1A sites (left) and the reclassified sites (right). (B) Genome browser snapshots of three genomic loci, harboring putative m1A peaks originally classified by Li and coworkers as originating from the 5′ UTR. The genomic reference is depicted at the bottom. The red lines overlapping each locus are reads, with bases diverging from the reference encoded by different colors (green - A, blue - C, orange - G, red - T). The black bars enclose the putative m1A sites. Although the gene annotations (depicted by arrows on the bottom) all indicate that the “official” gene start site is upstream of the modified site, it is apparent that all the misincorporations occur at the first base of the sequencing read. The top panel presents the mismatches upon m1A-IP, the bottom upon IP and demethylase treatment. (C) Barplots depicting the distribution of misincorporation events along the first 50 positions of the sequencing reads. Misincorporation in “TSS sites” (in blue) are highly skewed to occur in the first two positions, whereas misincorporation in TRMT6/61 sites (in red) are relatively uniformly distributed. (D) Boxplots depicting the percentage of misincorporation events occurring within the first or second base (from among all misincorporation events) at sites across the five classes.

