FIGURE 2.
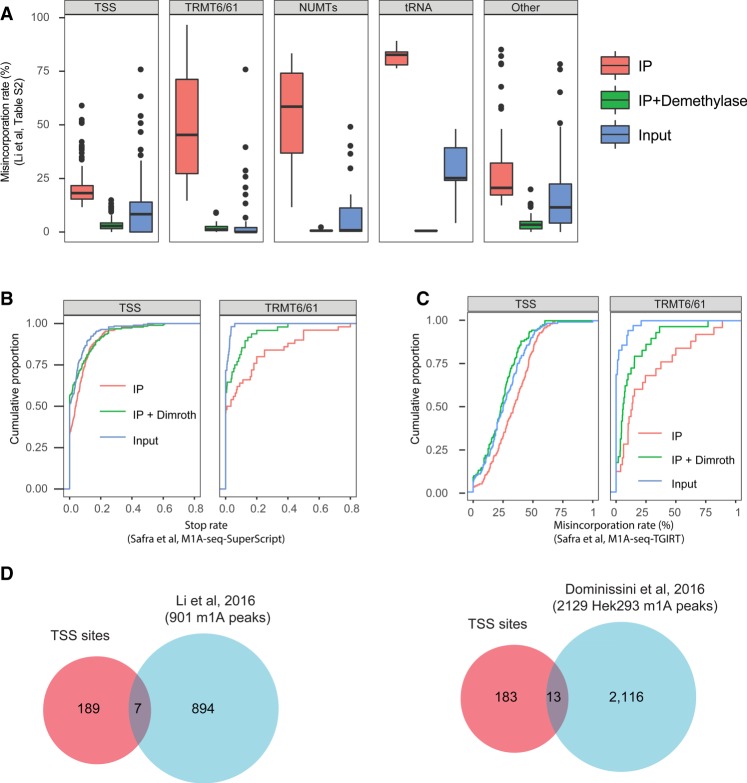
Characterization of TSS sites. (A) Distribution of misincorporation rates across Input, IP, and IP + Demethylase treated samples across the five different classes into which the Li et al. (2017) sites were reclassified, on the basis of the misincorporation ratios reported in Supplementary Table S2. These quantifications highlight strong enrichment of TRMT6/61A sites, but much reduced enrichment of TSS sites. (B) Analysis of the “stop rate,” defined as the fraction of reads beginning immediately after a site (indicating reverse transcriptase termination) divided by the number of reads overlapping it, on the basis of the m1A-seq-SuperScript data set released by Safra et al. (2017). SuperScript leads to a high termination rate of reverse transcription (and lower misincorporation rate) and hence serves as an orthogonal methodology for detecting m1A. The rate of termination does not differ significantly between IP and IP + Dimroth across TSS sites (left panel) in stark contrast to TRMT6/61A sites (right panel) used as positive control. (C) Analysis of the misincorporation rate at the Li et al. (2017) sites on the basis of the Safra and coworkers’ data set, aligned with the enforcement of an “end-to-end” (global) alignment parameter. Low differences are observed for TSS sites (left panel) in contrast to the TRMT6/61A sites (right panel). (D) Venn diagram depicting the overlap between the TSS sites, as classified here, and the sets of “m1A peaks” identified as enriched in Li et al. (2016) (left panel) and Dominissini et al. (2016) (right panel), respectively.

