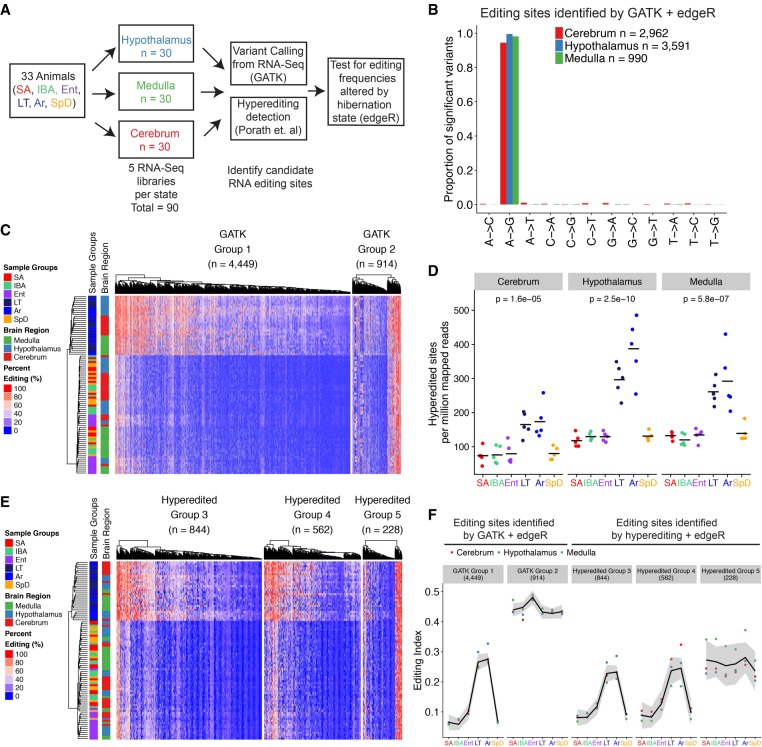
FIGURE 2.
A-to-I RNA editing is widespread and increases at low temperature during torpor and arousing from torpor. (A) RNA-seq library information and RNA editing site identification approach; see Figure 1 for full description of physiological stages. (B) Proportion of variants identified by the GATK pipeline for each possible mismatch type that have significantly changed editing frequencies across hibernation sampling timepoints determined via GLM analysis (FDR < 0.01). (C) Heatmap depicting editing frequencies defined as the percentage of G containing reads over the reads with either A or G. Group 1 or Group 2 sites were defined by k-means clustering (k = 2 classes), and within each Group, editing sites and individual samples were ordered by hierarchical clustering. (D) The number of editing sites detected by the hyperediting approach in each brain region (panel) and hibernation state (color) normalized to the total number of uniquely mapped reads. P-values were determined via ANOVA. (E) Heatmap of editing frequencies for sites identified by the hyperediting approach that are significantly changing across hibernation states. Groups were defined with k-means clustering (k = 3 classes) and sites were ordered with hierarchical clustering. (F) Editing index for significant sites identified by the GATK or hyperediting approach across sampled hibernation states. The editing index is defined as the sum of all G containing reads for all significant sites over the sum of all reads at significant sites. Lines are fit using a loess method and shaded area indicates standard error estimates derived from the t-distribution.

