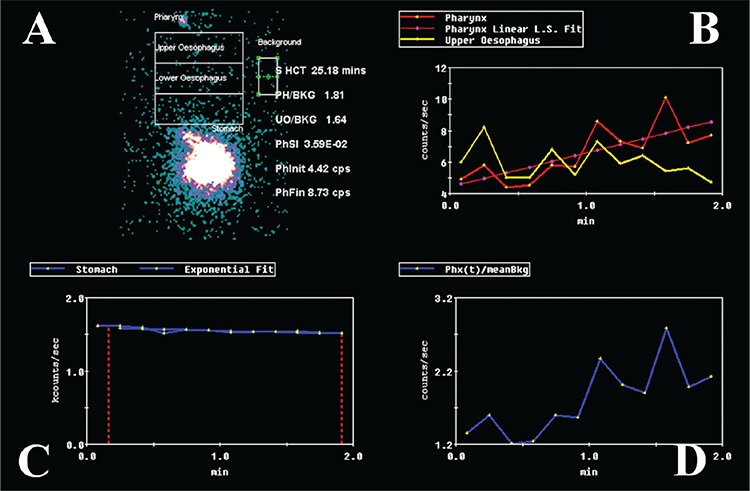
Figure 2. Graphical analysis of the dynamic study. Panel A shows the regions of interest for the pharynx, upper and lower oesophagus and the background regions as well as the relevant results. Panel B shows the time-activity curves for the pharynx (red) with its fitted curve (pink) and the curve for the upper oesophagus (yellow). Panel C is the gastric emptying curve with the time to half clearance being shown at 25.2 minutes in panel A. Panel D indicates the ratio of pharynx to background.

