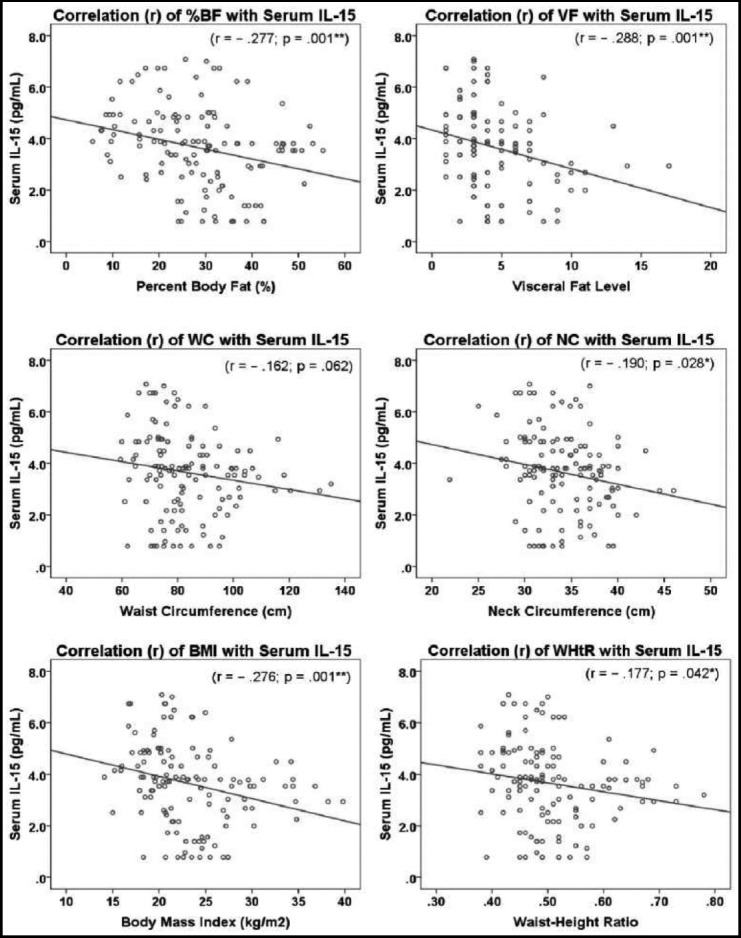
Fig.2.

Scatter plot showing correlation (r) between pre-exercise serum interleukin-15 levels (IL-15) (pg/ml) and adiposity indices including Body Fat (BF) (%), Visceral Fat Level (VF), Waist Circumference (WC) (cm), Neck Circumference (NC) (cm), Body Mass Index (BMI) (kg/m2) and Waist-Height Ratio (WHtR) in study participants. p < .05 termed significant.
