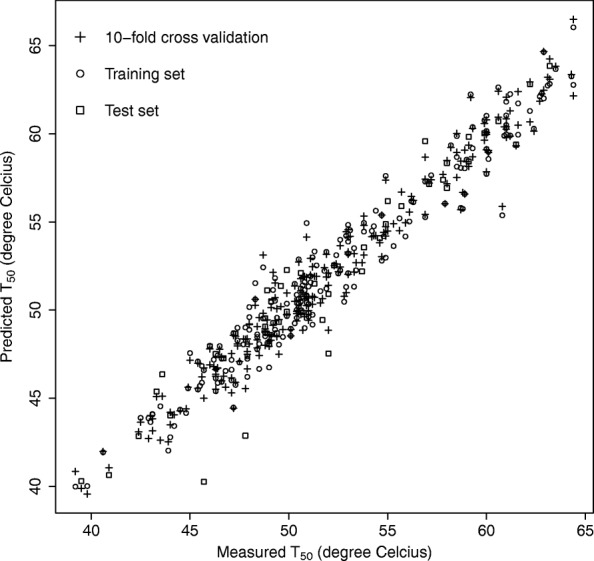
Fig. 4.

Evaluation of iSAR for modelling the thermostability of cytochrome P450 variants. Shown are the measured against predicted thermostability values (melting temperature in °C) assessed under the 10-fold cross-validation scheme for the full set of 242 ϖαριαντσ (+), for a training set composed of 80% of the dataset (○) and for a validation set comprising 20% of the variants (□)
