
Fig. 5.
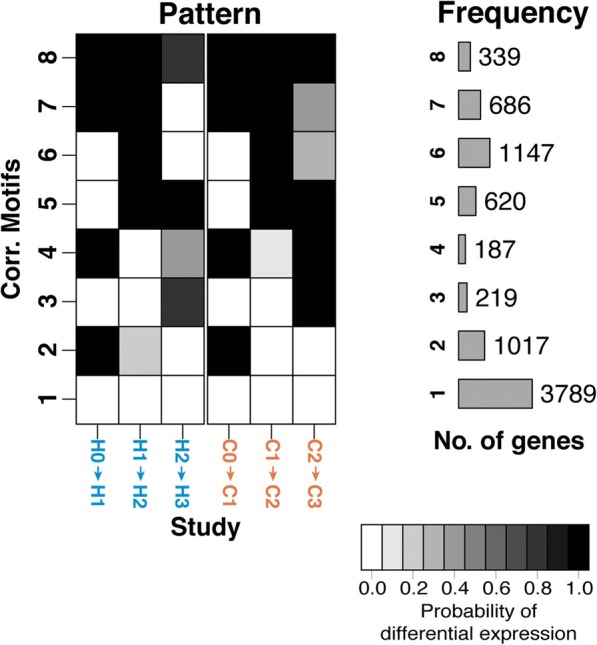
Gene expression motifs. Correlation motifs based on the probability of differential expression across days for each species with the number of genes assigned to each correlation motif. The shading of each box represents the posterior probability that a gene is DE between two time points in a given species. Each row (“correlation motif”) represents the most prevalent expression patterns. Out of 10,304 genes, 8004 were assigned to one correlation motif in this model