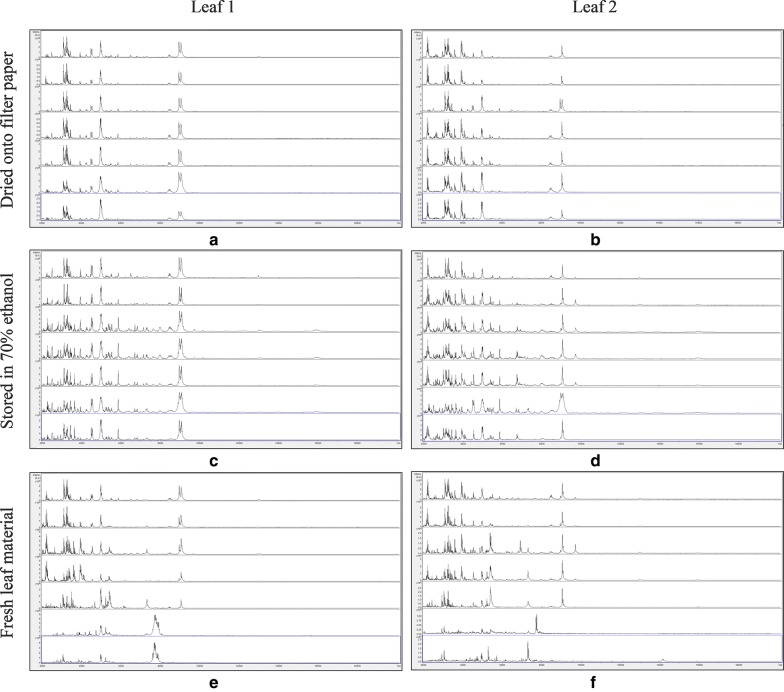
Fig. 1.
MALDI-TOF MS spectra for duplicate leaf samples of Fallopia japonica, with samples, from top to bottom within each panel, processed immediately and after storage for 3, 8, 14, 21, 30, and 36 days at 20 °C. The samples are: a leaf 1, dried down on filter paper; b leaf 2, dried down on filter paper; c leaf 1, stored in 70% (v/v) ethanol; d leaf 2, stored in 70% (v/v) ethanol; e leaf 1, untreated; and f leaf 2, untreated. Spectra are shown baseline-subtracted, smoothed, y-axis-autoscaled, and covering the mass range 2–20 kDa (with x-axis scale increments of 2 kDa)

