
Figure 1. Proposed strategy for high-content screening the therapeutic re-education macrophages.
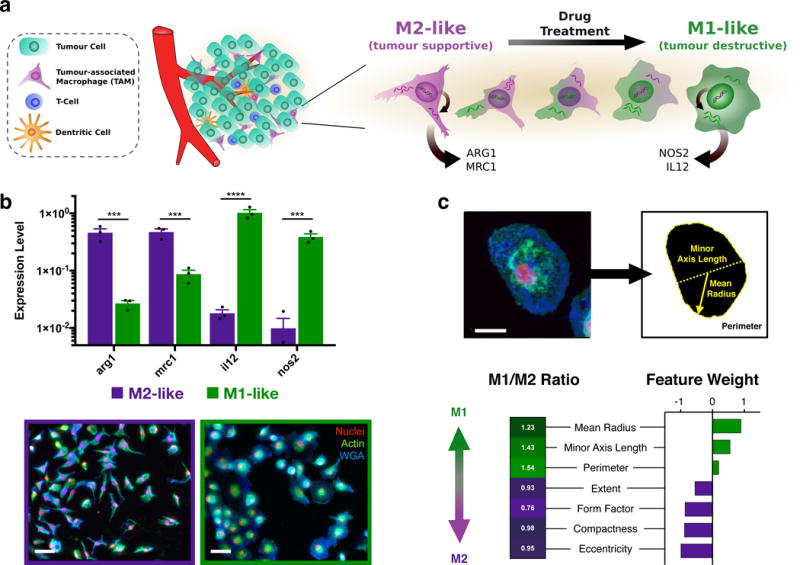
a, Schematic overview of the tumour microenvironment in which abundant tumour associated macrophages (TAMs) are canonically M2-like (tumour supportive), but exhibit a range of behavior which may be pharmacologically influenced. b, Gene expression of M2-like (IL-4 treated) and M1-like (LPS/INFγ treated) murine macrophages (top). Data represent mean ± s.e.m. of fold change relative to hprt, N=3 independent replicates from a single experiment. ***P<0.0005, ****P<0.00001 (two-way ANOVA, Fisher LSD). Gross observation of cell shape (bottom) for M2- and M1-like polarization states in murine macrophages. Scale bar: 50 μm. c, Raw images were processed by automated segmentation (top), allowing measurement of prominent features (indicated, yellow) useful in identification of M1-like polarization which include the mean radius (solid line), minor axis length (dotted line), and perimeter (dashed line). Cells are stained for nuclei (DAPI, red), actin (phalloidin, green), and cell membrane (WGA, blue). Scale bar: 25 μm. Morphological phenotyping was conducted by random forest assignment of cells to an M1- or M2-like state, where feature weights determined are reflective of the relative differences in M1-like and M2-like training sets. For the complete CellProfiler Pipeline and complete definition of cell shape features examined, please refer to Supplementary Table S1.