
Figure 2. In vitro assessment of macrophage phenotype.
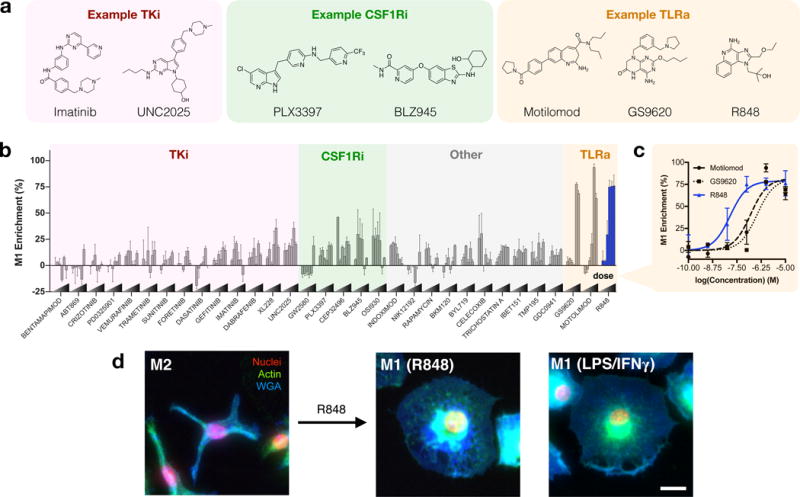
a, General classification and examples of drugs of interest, including tyrosine kinase inhibitors (TKi), colony-stimulating factor 1 receptor inhibitors (CSF1Ri), and toll-like receptor agonists (TLRa). b, Morphological determination of M1 enrichment of murine macrophages in response to drug treatment at variable concentrations. For a complete listing of compounds screened, drug targets, and concentration ranges, please refer to Supplementary Table S2. c, Dose response of M1 enrichment in response to TLR agonists. Data represent the mean ± range of N=2 independent experiments, each examining n>100 cells per condition. d, Representative images (N=4 independent experiments) of M2-like murine macrophages and subsequent re-education by R848 (48 hours, 100nM). Right: M1-like (LPS/IFN-γ treated) cell, provided for comparison. Cells are stained for nuclei (DAPI, red), actin (phalloidin, green), and cell membrane (WGA, blue). Scale bar: 25 μm.