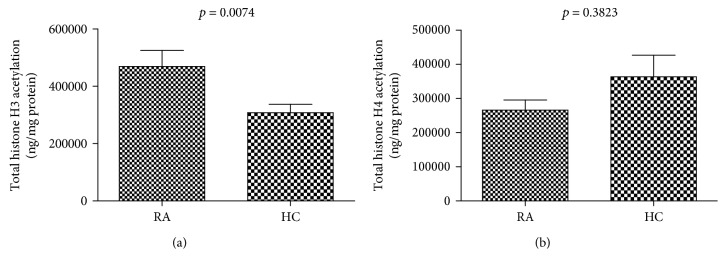
Figure 5.
The level of total histone H3 and H4 acetylation in PBMCs of RA patients compared to HCs. The total histone H3 and H4 acetylation levels were measured using the colorimetric histone H3 and H4 acetylation assay. (a) A significant increase in total histone H3 acetylation levels in RA (n = 12) PBMCs compared to HCs (n = 10). (b) Lower but not statistical significance in the total histone H4 acetylation levels between RA patients and HCs.

