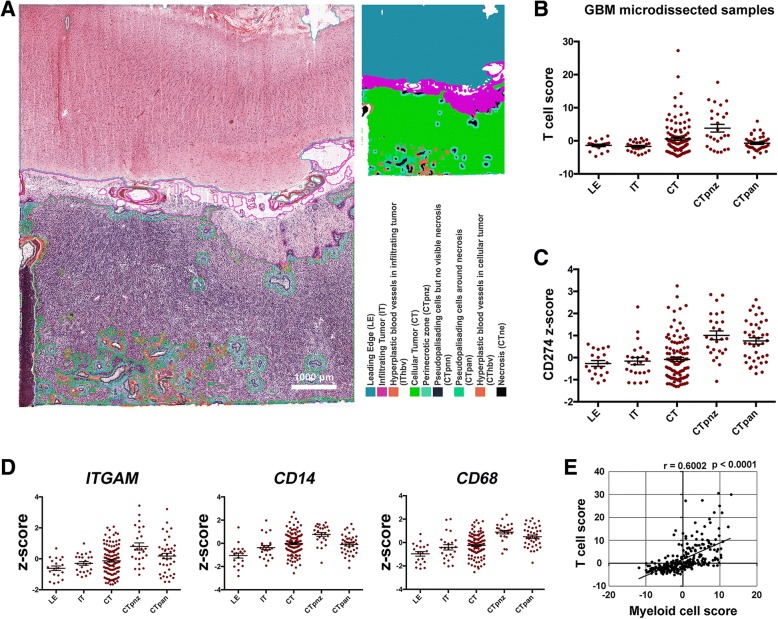
Fig. 4.
Distribution pattern of tumor-infiltrating T cells and PD-L1 in human glioma samples. a Tumor feature annotation of human glioma sample in the Ivy Glioblastoma Atlas Project. Scale bar, 1000 μm. Image credit: Allen Institute. T cell score (b) and PD-L1 expression (c) in different parts of human glioma samples, n = 19–111. LE, leading edge; IT, infiltrating tumor; CT, cellular tumor; CTpnz, perinecrotic zone; CTpan, pseudopalisading cells around necrosis. d The expression of myeloid cell signature genes in different parts of human glioma samples according to the Ivy Glioblastoma Atlas Project, n = 19–111. e Correlation analysis between T cell score and myeloid cell score in human glioma samples. The data were derived from the Ivy Glioblastoma Atlas Project. Pearson’s correlation coefficient was performed

