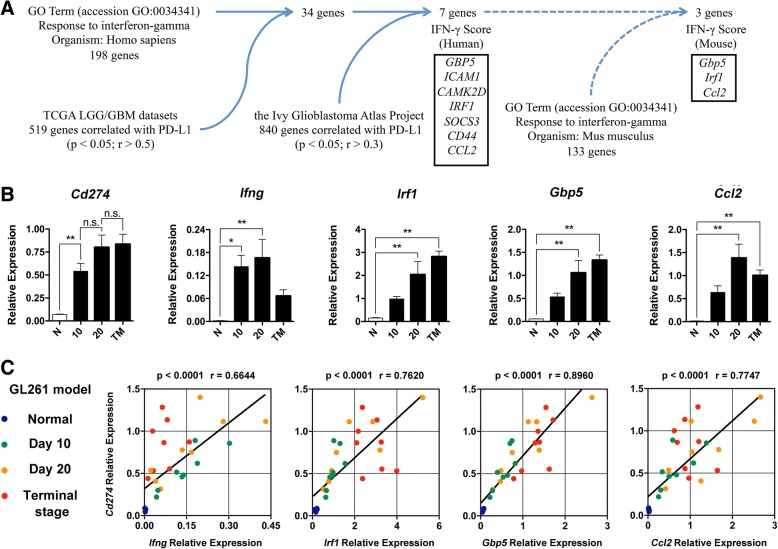
Fig. 5.
IFN-γ-induced genes are positively correlated with progression of glioma and PD-L1 expression. a The schematic figure of selection strategy for genes to calculate IFN-γ score in mouse. b The statistical summary for the expression of Cd274, Ifng, Irf1, Gbp5, and Ccl2 in different progression stages of murine GL261 glioma, n = 8. c Correlation analysis of the expression of Cd274 with Ifng, Irf1, Gbp5, and Ccl2 in different progression stages of murine GL261 glioma. One-way ANOVA was performed in b. Pearson’s correlation coefficient was performed in c. *p < 0.05; **p < 0.01. All values are shown as mean ± SEM

