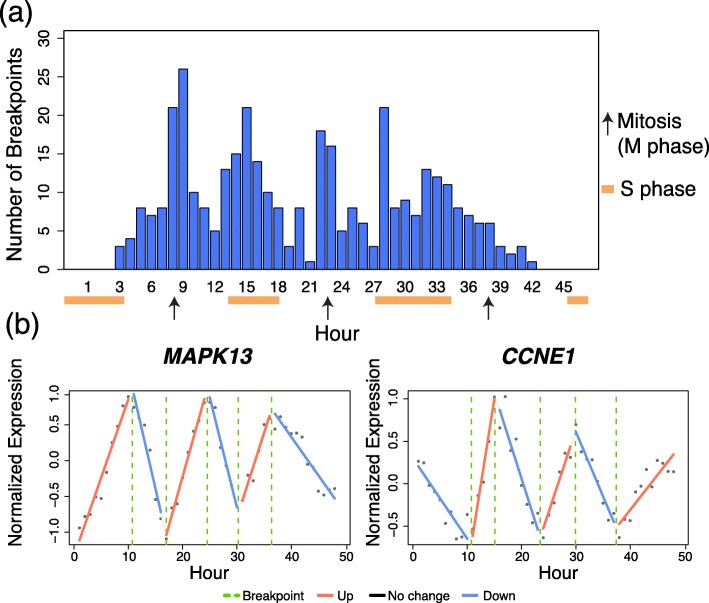
Fig. 3.
Results of Trendy on the Whitfield dataset. Panel a is the breakpoint distribution for the 118 genes having . Orange bars indicate the S phase and black arrows indicate the time of mitosis as shown in Figures 1 and 2 in Whitfield et al., 2002. Panel b contains two genes identified by Trendy with different expression dynamics over the time-course

