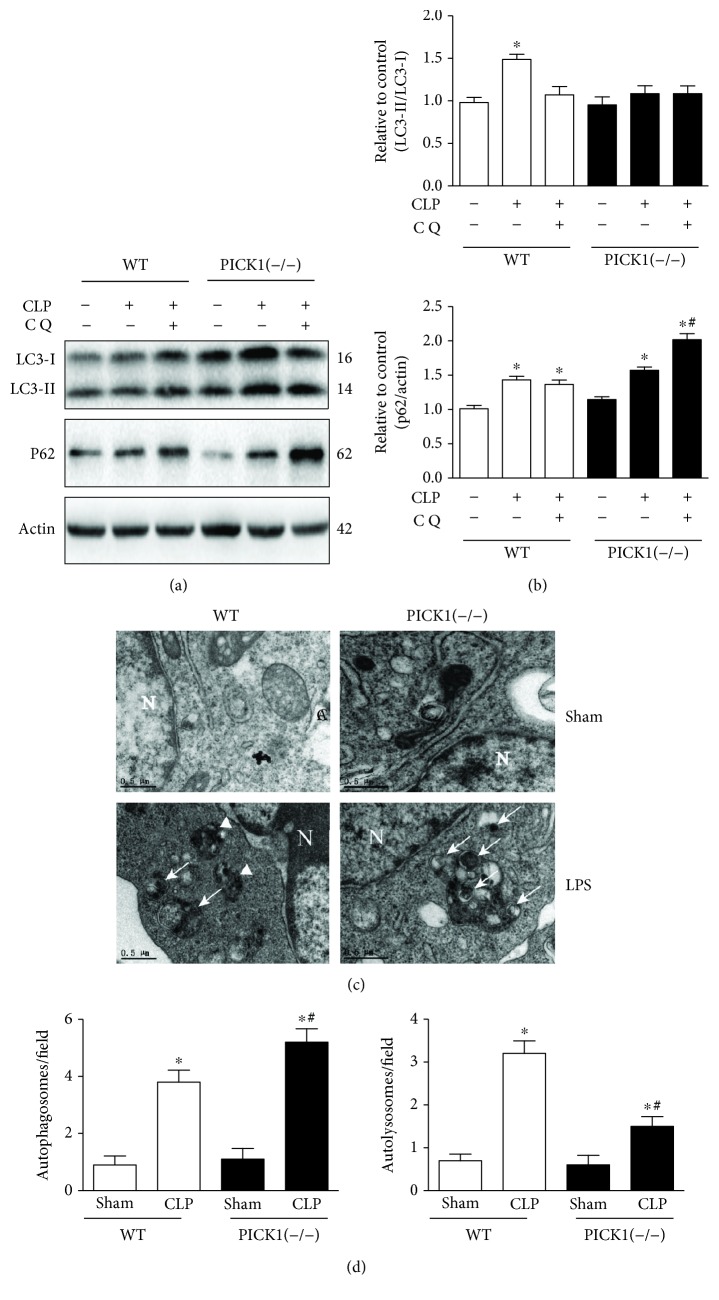
Figure 2.
PICK1 deficiency disrupted the autophagic flux. Lungs were harvested 24 h post-CLP. (a, b) Representative Western blot images and statistical analysis of LC3-II/LC3-I ratio and p62 levels in PICK1−/− mice. (c) Representative TEM images of autophagic structures in BMDMs. Autophagosomes are indicated by arrowheads and autolysosomes are shown by arrows (magnification, 10,500x). (d) Statistical analysis of autophagosomes and autolysosomes. Results represent the mean ± SEM of independent experiments of animals (n = 6) and cells (n = 3). ∗P < 0.05 vs. sham-operated group; #P < 0.05 vs. CLP mice in the WT group.

