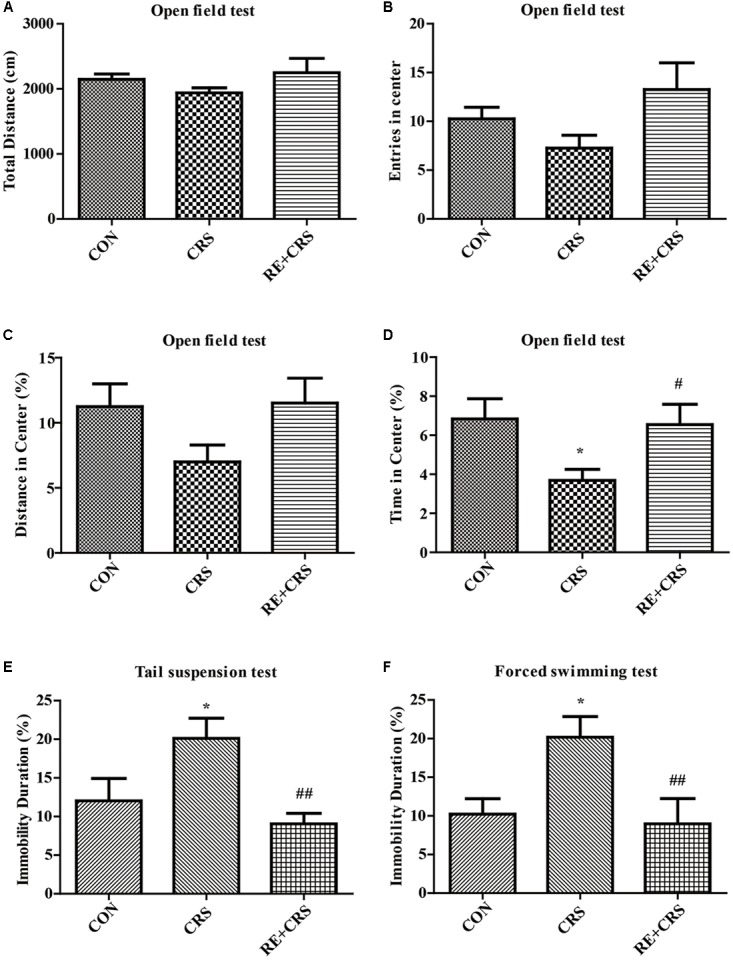
FIGURE 1.

Antidepressant-like behaviors of RE in CRS mice. (A) Total distance in OFT. (B) Entries in center in OFT. (C) Distance in center in OFT. (D) Time in center in OFT. (E) Immobility duration in TST. (F) Immobility duration in FST. Data were shown as mean ± SEM. ∗P < 0.05, ∗∗P < 0.01 vs. CON; #P < 0.05, ##P < 0.01 vs. CRS. n = 12 per group. CON, CRS and RE + CRS represent the control group, the group of chronic restraint stress, and the treatment group of rosemary extracts pretreatment plus chronic restraint stress, respectively.
