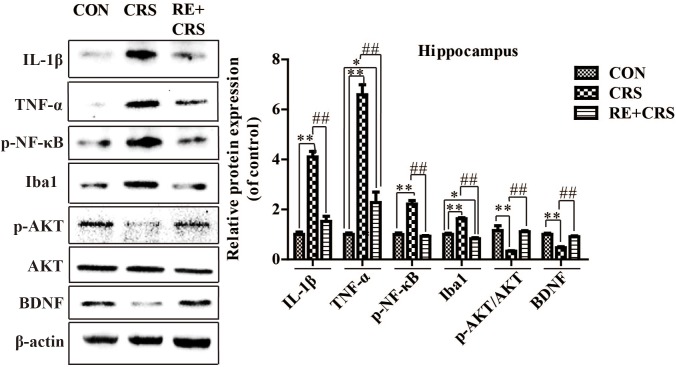
FIGURE 3.
Protein expression of IL-1β, TNF-α, p-NF κ B, Iba1, p-AKT/AKT and BDNF in hippocampus. IL-1β, TNF-α, p-NF κ B, Iba1, p-AKT/AKT and BDNF protein expression in hippocampus was detected by western blot. Data were shown as mean ± SEM. ∗P < 0.05, ∗∗P < 0.01 vs. CON; #P < 0.05, ##P < 0.01 vs. CRS. n = 4 per group. CON, CRS and RE + CRS represent the control group, the group of chronic restraint stress, and the treatment group of rosemary extracts pretreatment plus chronic restraint stress, respectively.

