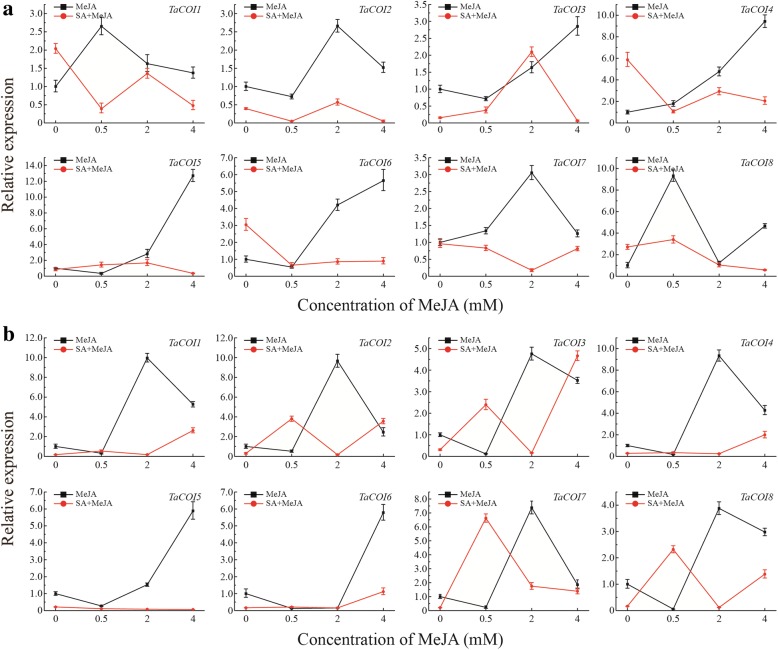
Fig. 9.
Expression profiling of TaCOI genes in glumes (a) and anthers (b) treated with MeJA (0 mM 0.5 mM, 2 mM, and 4 mM) and SA (10 mM). Values on the x-axis indicate the MeJA concentration. MeJA: spikelets were treated with MeJA (0 mM, 0.5 mM, 2 mM, and 4 mM). MeJA + SA: SA (10 mM) and MeJA interaction treatment. The error bars indicate the standard deviation of three replicates

