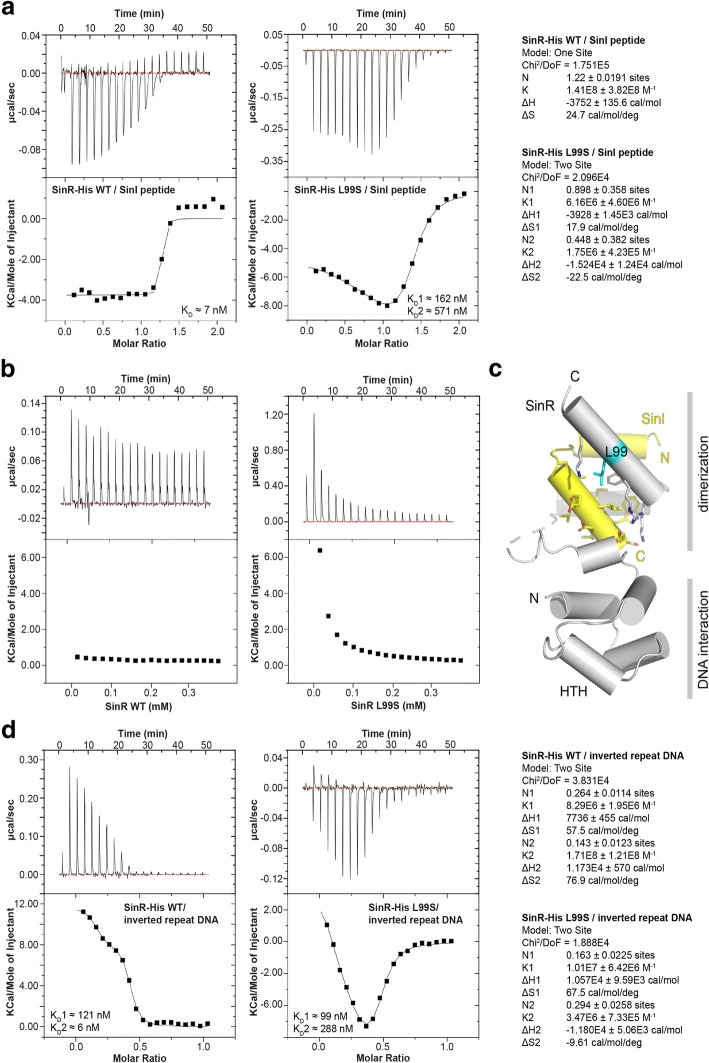
Fig. 3.
SinR-L99S differs in its interaction with SinI and DNA. a ITC measurments of the interaction between the SinI peptide and SinR (left thermogram) and SinR-L99S (right thermogram). Derived thermodynamic parameters are shown on the right site. b ITC complex dissociation experiments of SinR (left thermogram) and SinR-L99S (right thermogram). c Cartoon representation of the B. subtilis SinR/SinI complex crystal structure (PDB-ID: 1B0N; Newman et al. 2013). SinR is colored in grey and SinI is colored in yellow. Leucine 99 (cyan) and the sourrunding SinR/SinI interface region is shown in stick representation. N and C indicate N-termini and C-termini, respectively. d ITC measurments of the interaction between the inverted repeat DNA and SinR (left thermogram) and SinR-L99S (right thermogram). Derived thermodynamic parameters are shown on the right site

