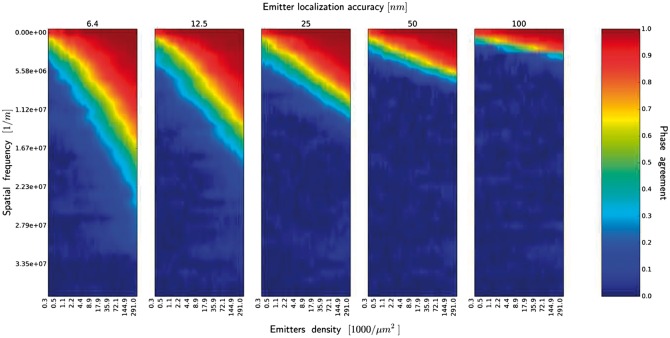
Fig. 9.
Similarity measure in frequency space, emitters rendered with squares with side d = 32 nm (image of neuronal tissue). The spectrum of similarity measure is shown as a function of emitters density, for different emitters localization accuracy. Only the lowest 1/3 of the function with the sampling resulting from the reference image resolution has been displayed

