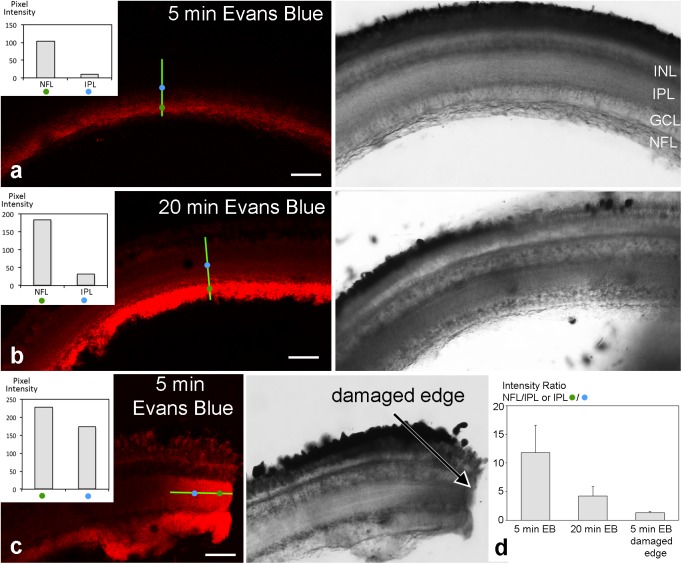
FIGURE 9.
Unfixed retinal slices after eyecup treatment with Evans Blue. Confocal images are shown on the left, transmitted light images of the corresponding areas on the right. Fluorescence intensity was measured at two locations of 1 μm2 indicated by the blue and green circles 30 μm apart on a transect line (bright green) and are shown in the insets. After 5 min incubation time with Evans Blue dye, fluorescence is largely limited to the NFL (a). After 20 min incubation time, some dye has diffused to the inner layers of the retina (b). However, a sharp drop in fluorescence intensity remains from the NFL to inner and outer retinal layers. In contrast, in control preparations where eyecups had been incised prior to dye application, the dye diffused more readily from the cut end (arrow) into all retinal layers (c). In (d), the intensity ratios of individual measurements from locations as indicated in (a–c) are compared. A ratio of 1 would mean the same intensity at both measurement locations and unobstructed spread of the dye. The values >>1 for the experimental slices are consistent with the hypothesis that the NFL forms a diffusion barrier from the vitreous to the inner retinal layers. Error bars are SD (n = 13 for experimental and n = 9 for control sections). INL inner nuclear layer; IPL, inner plexiform layer; GCL, ganglion cell layer; NFL, nerve fiber layer. Scale bars 50 μm.

