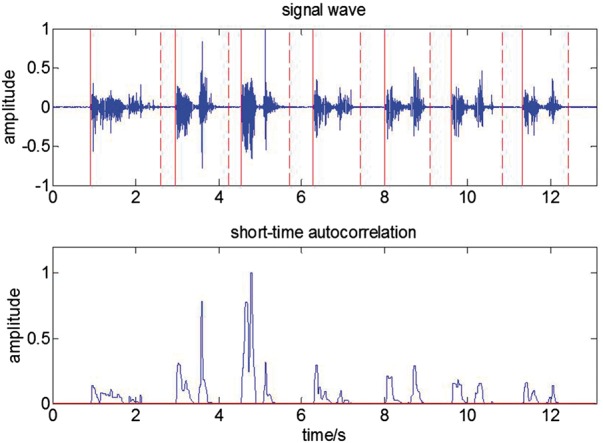
Fig. 7.

Segmentation. The signal wave was segmented by the red solid lines and red dashed lines. The red solid line is the start of the respiratory cycle and the red dash line is the end of the cycle. The bottom panel shows short-time autocorrelation
