
Figure 3:
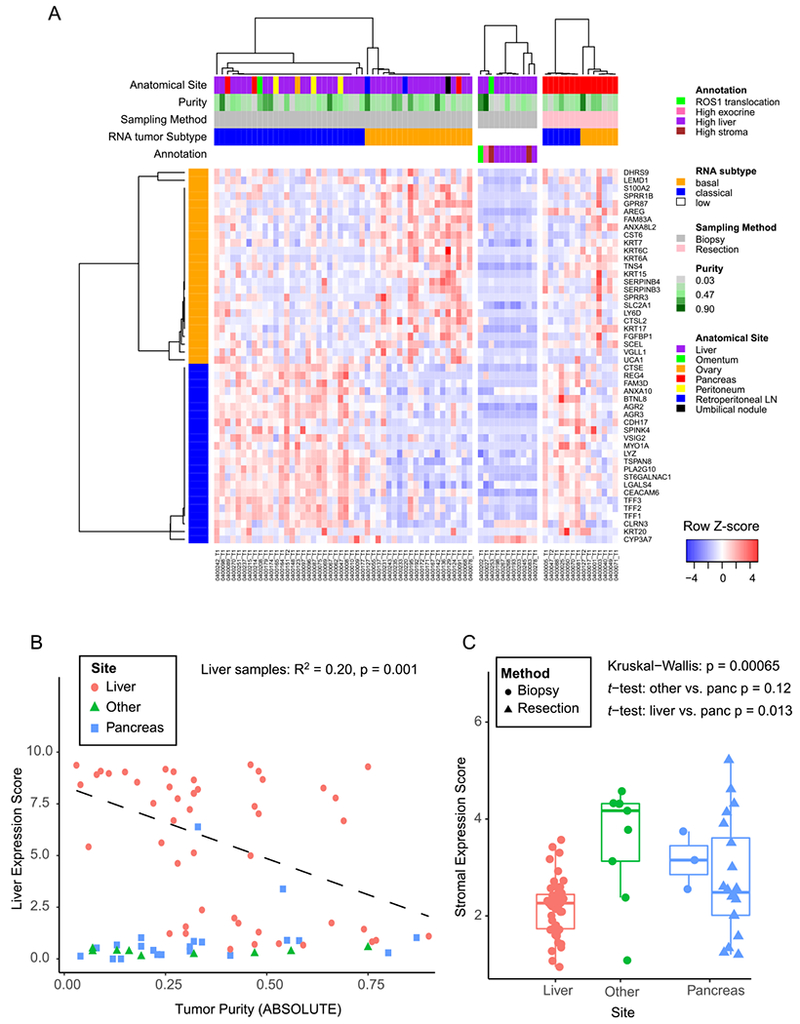
PDAC gene expression signatures in biopsy cohort. A) Heatmap showing each sample as a column, with rows displaying genes sets defining the Moffitt Basal-like (orange bar) and Classical (blue bar) PDAC gene expression programs (14). Tracks at the top also show anatomic site and ABSOLUTE purity by WES of the sample. To the right of the main biopsy heatmap, samples with low tumor content (middle panel), and samples from resected cases (right most panel) are shown. B) Liver gene expression score (y-axis) is plotted versus the ABSOLUTE purity of each sample (x-axis). The linear regression shown includes only samples from the liver. C) A composite stromal score is displayed for each sample, with samples binned according to the biopsy site. Boxplots represent first, second and third quartiles, and whiskers depict the furthest sample from the median which is within 1.5 times the inter-quartile range.