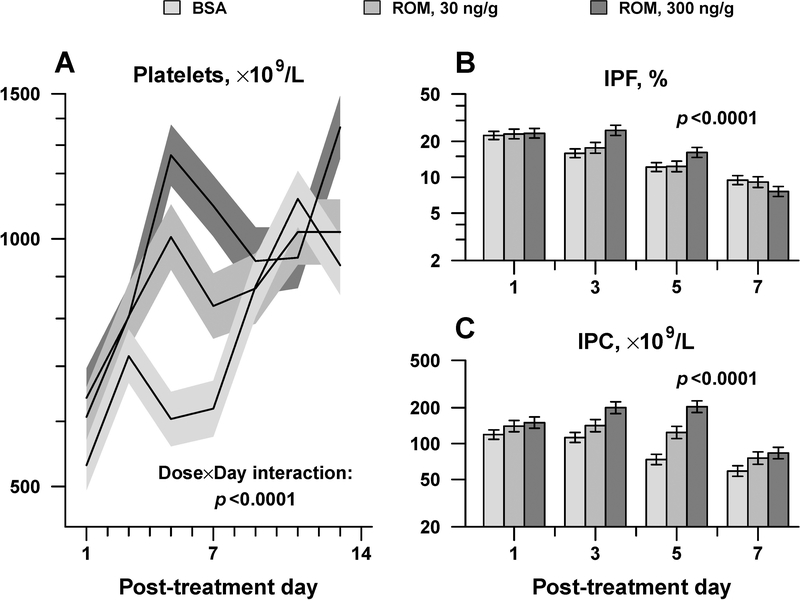
Figure 3.
Newborn mice dose-responses to ROM. Platelet counts (A), IPF (B), and IPC (C) were measured every other day after a single SC injection of ROM at the indicated doses (n=17 pups per group). Data is presented as mean ± standard error. Displayed p-values are from repeated-measures analysis of variance, testing whether the magnitude and timing of peak response varied according to ROM dose (Dose x Day interaction).

