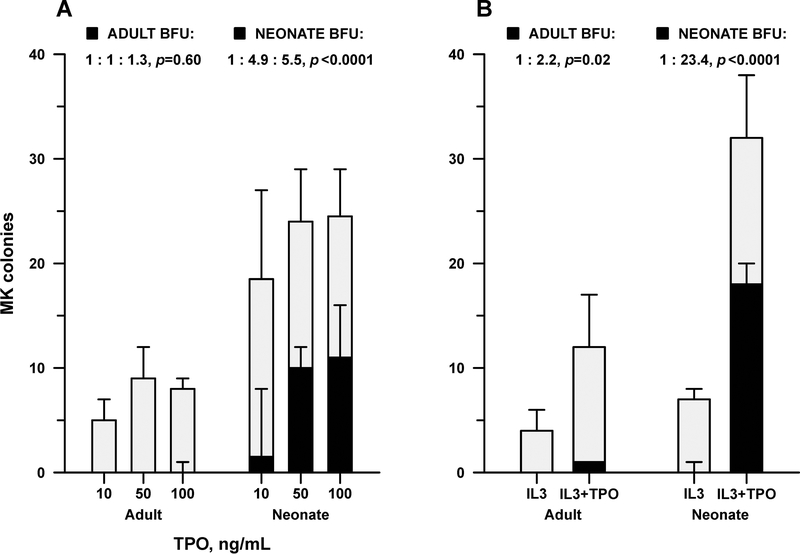
Figure 5.
In vitro dose-response of newborn liver and adult BM hematopoietic progenitor cells to mTPO. The full bars indicate the number of total MK progenitors and the black areas indicate the subset of more primitive progenitors, the Burst Forming Unit-MKs (BFU-MKs), cultured in each chamber from adult BM (n=5) and neonatal liver (n=6) in response to increasing concentrations of mTPO (10–100 ng/mL) (A), or to IL-3 ± 50 ng/mL of mTPO (B). Bars represent the median, with error bars reaching to the 75th percentile. Where a bar is not visible, median count was 0; where the error bar is not visible, the 75th percentile was equal to the median. Displayed ratios, corresponding to the solid bars below, are derived from mixed-model analysis of variance of log-transformed BFU counts. P values indicate whether any ratio differed from 1.

