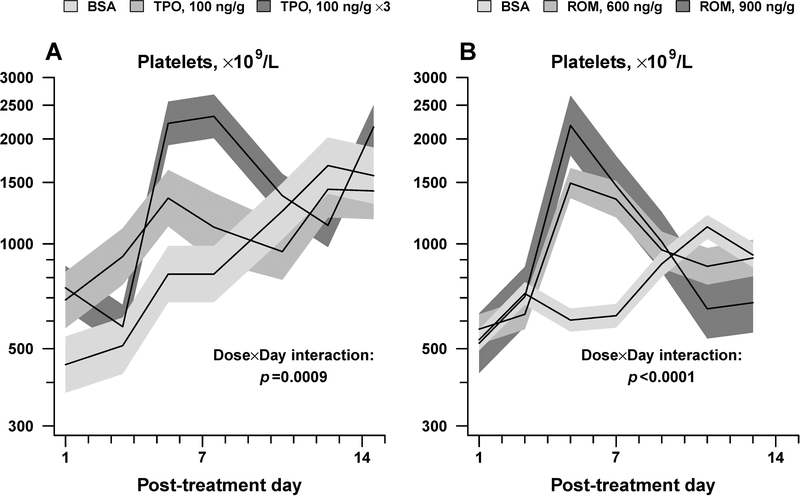
Figure 6.
In vivo response of newborn mice to mTPO (100 ng/g) given daily for 1 day or 3 days (A) and to single ROM doses of 600 and 900 ng/g (B). Data is shown as mean platelet counts ± standard error (shaded areas). (n=3–6 mice per group). Displayed p-values are from repeated-measures analysis of variance, testing whether the magnitude and timing of peak response to TPO or ROM varied according to dose (Dose x Day interaction).

