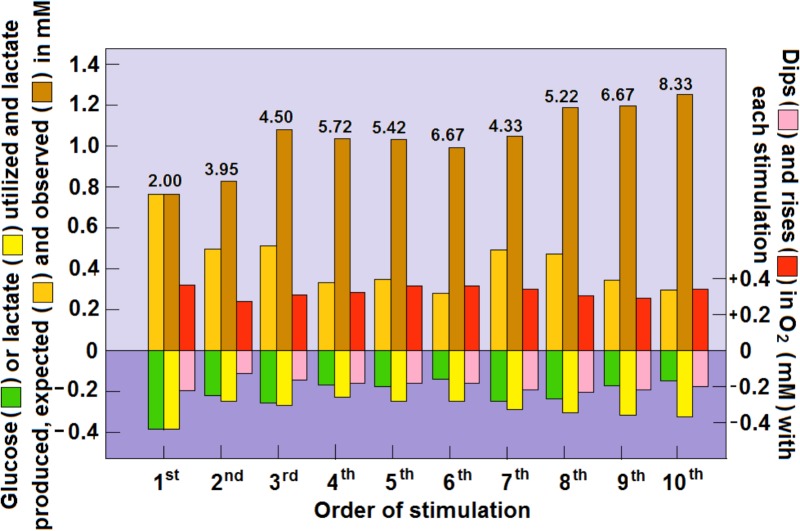
FIGURE 4.
Dynamic relationships of local extracellular glucose, lactate and O2 levels in the rat hippocampal dentate gyrus during a series of 5 s electrical stimulations of the perforant pathway at 2 min rest intervals. The concentrations of glucose, lactate and O2 were calculated from their dips and rises as measured by Hu and Wilson (1997) using rapid response sensors in their original study. The numerical values above the columns representing the rises in glucose and lactate post-stimulation are the calculated ratios between the two. For additional details see Figure 3 and Schurr and Gozal (2011).

